Objective:
Effective digestion of protein into smaller peptides or amino acids is a key for absorption of nutrients into the human body. Product digestion under artificial human digestive tract conditions was examined, comparing the digestion profiles of OP2 Labs FrogFuel/ProT GOLD with those of competitors’ products.
Methods:
Sample digestion. Each of the samples containing 0.37 g of protein was dissolved in pre-warmed 50 ml of the simulated gastric fluid (151 mM NaCl, 0.6g/l of Pepsin, pH 2.0). This time point was set as 0. Samples were incubated at 37C for 15 minutes with shaking at 200 rpm. 50 ml of simulated intestinal fluid (71 mM of Sodium bicarbonate, 0.425 g/l of Trypsin, 0.06g/l of Chymotrypsin, 15 mM of Sodium taurocholate) were then added and incubation continued further. 100 l of samples at time points 15, 30, 60 and 90 minutes were taken and mixed with 100 l of 2x SDS-Sample buffer containing 5% -mercaptoethanol. They were immediately boiled for five minutes on heat blocks set to 100 C. The samples were placed on ice for five minutes and then stored at -80 C until SDS-PAGE was performed. Since proteinase activities were quite high and the protein degradation immediately start in these conditions, samples for the time point 0 were prepared from a pre-heat-inactivated 100 ml of 1:1 mixture of the simulated gastric fluid and simulated intestinal fluid right after dissolving each sample containing 0.37g of protein. A 100 l of the aliquot was mixed with 100 l of 2x SDS-Sample buffer containing 5% -mercaptoethanol and immediately boiled for five minutes on heat blocks at 100 C. The samples were placed on ice for five minutes and then stored at -80 C until SDS-PAGE is performed.
For the FrogFuel product, 2x (0.74g) and 5x (1.85g) amounts of proteins were also subjected to the same experiment together with 1x (0.37g).
Electrophoresis. 18% pre-cast Criterion Tris-HCl gels for SDS-PAGE were purchased from Bio-Rad. Protein molecular mass markers, Ultra Low Molecular Weight Marker, were purchased from SIGMA. All samples were thawed on at room temperature and centrifuged at 16,200g, 4C for 1 min. 10 l or 20 l each of the samples were loaded onto the gel. Samples were separated on 18% or 12.5% gels at 120V. Electrophoresis was stopped when the dye-front migrated to within few centimeters of the bottom of the gel. The gels were removed from cassettes and washed for 10 min twice with deionized water. The gels were incubated in 5% Glutaraldehyde for one hour for fixation. After two timed washes with deionized water (five minutes each), gels were stained with Coomassie brilliant blue staining solution (0.1% Coomassie Brilliant blue, 50% Methanol, 10% Acetic Acid) for 20 minutes. De-staining was done with de-staining solution (50% Methanol, 10% Acetic Acid).
Densitometry analysis. The gels were scanned by LI-COR Odyssey Imager and images were exported as 600 dpi TIFF files. NIH ImageJ software was used for densitometry analysis of the protein bands. TIFF images were converted to 8-bit grayscale image. The subtract background function was used to remove background from the image with a rolling ball radius of 400 pixels. Then the images were converted to binary. Densitometry analysis was performed for protein bands larger than 1 kDa or 6 kDa of milk-based samples or plant-based samples, respectively.
Figure 1. Coomassie stained SDS-PAGE gel comparing digestion profiles of FrogFuel product with competitors’ products. 10 l of each sample were loaded in this gel. Molecular mass markers were loaded on the far left and the sizes were shown on the left in kDa. Absence of (or very weak) protein bands in FrogFuel/ProT GOLD products was probably because of protein pre-digestion by fruit enzymes.
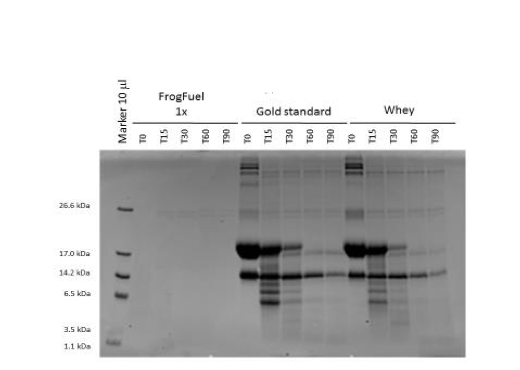
Figure 2. Coomassie stained SDS-PAGE gel comparing digestion profiles of FrogFuel product. 1x (0.37g), 2x (0.74g) and 5x (1.85g) of FrogFuel/ProT GOLD proteins were digested over time. 20 l each of samples were loaded in this gel. Molecular mass marker was loaded on the left and the sizes were shown on the left in kDa.
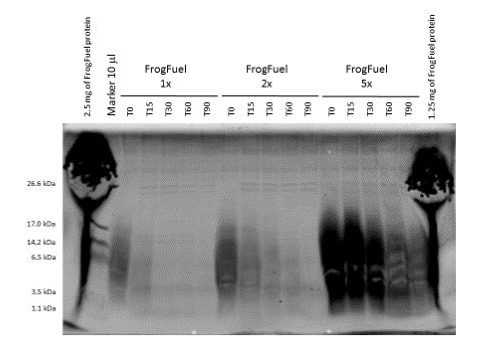
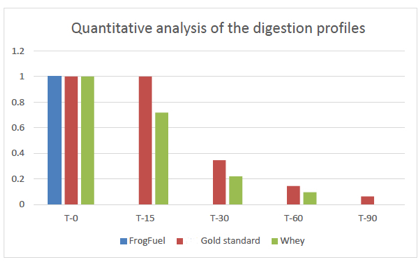
Figure 3. Densitometry analysis results of FrogFuel/ProT GOLD, and competitor whey products. Total amount of protein bands for each product at time point 0 was calculated as 100% and shown as 1. The relative amounts of total protein bands at each time points, 15, 30, 60 and 90 minutes, were calculated. Complete degradation of FrogFuel product was observed at 15 minutes, whereas other whey products still had more than 70% of proteins detected.
Conclusions:
Compared to competitor whey products, FrogFuel/ProT GOLD evidenced only smaller sizes and densities of protein bands from time 0. Complete degradation of FrogFuel product was observed at 15 minutes, whereas other whey products still had more than 70% of proteins detected at that time. Our interpretation is that FrogFuel/ProT GOLD’s predigestion with fruit enzymes results in degradation faster than our assay can resolve and much faster than competing products under the simulated gastric conditions used.
Authorized By: Takanori Hirano, Ph.D. Date: 07/02/15
Kennesaw State University - Department of Cellular and Molecular Biology